Introduction
I was looking through the Asahi driver issue tracker in Mesa, and came across an interesting misrendering issue in a Mario Kart Wii emulator (WiiCompiled). I decided it would be a good first issue for me to attempt to solve in the project. But boy was I… right? It turned out to be one of the most complicated bugs I’ve tracked down, but it was quite fun, and I’m pretty proud of it. I’ll share the process I went through to figure this out.
The Issue
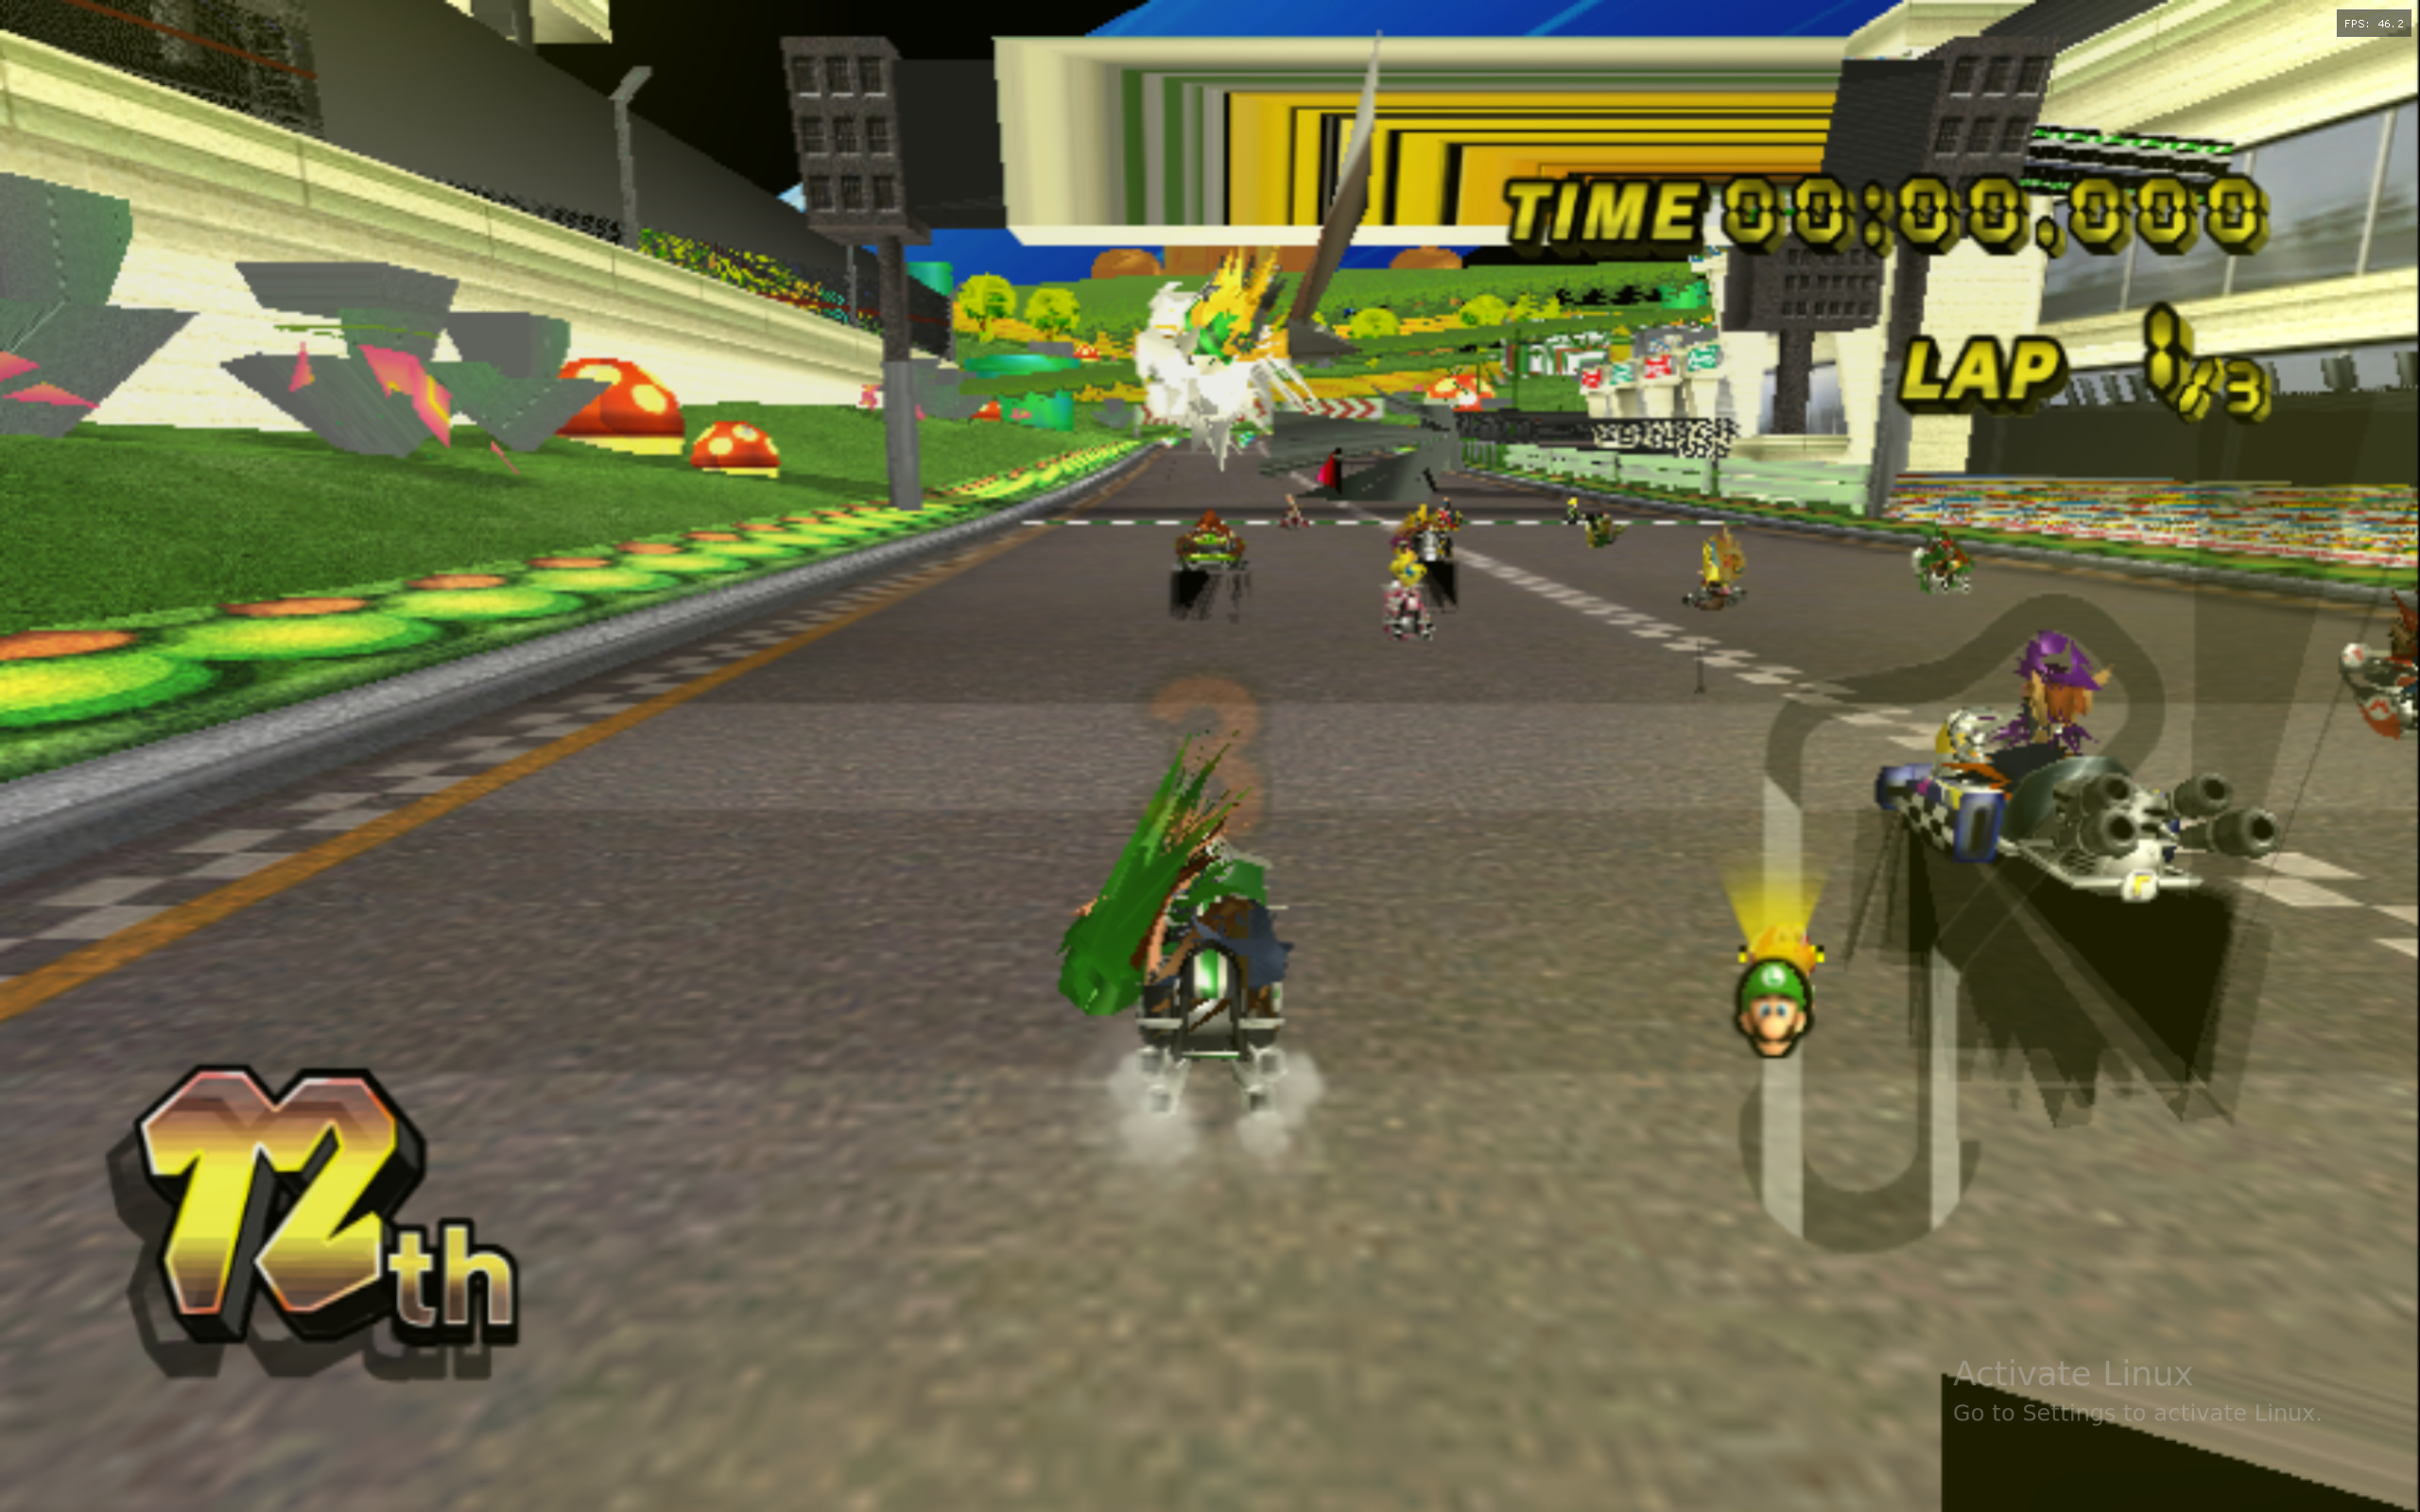
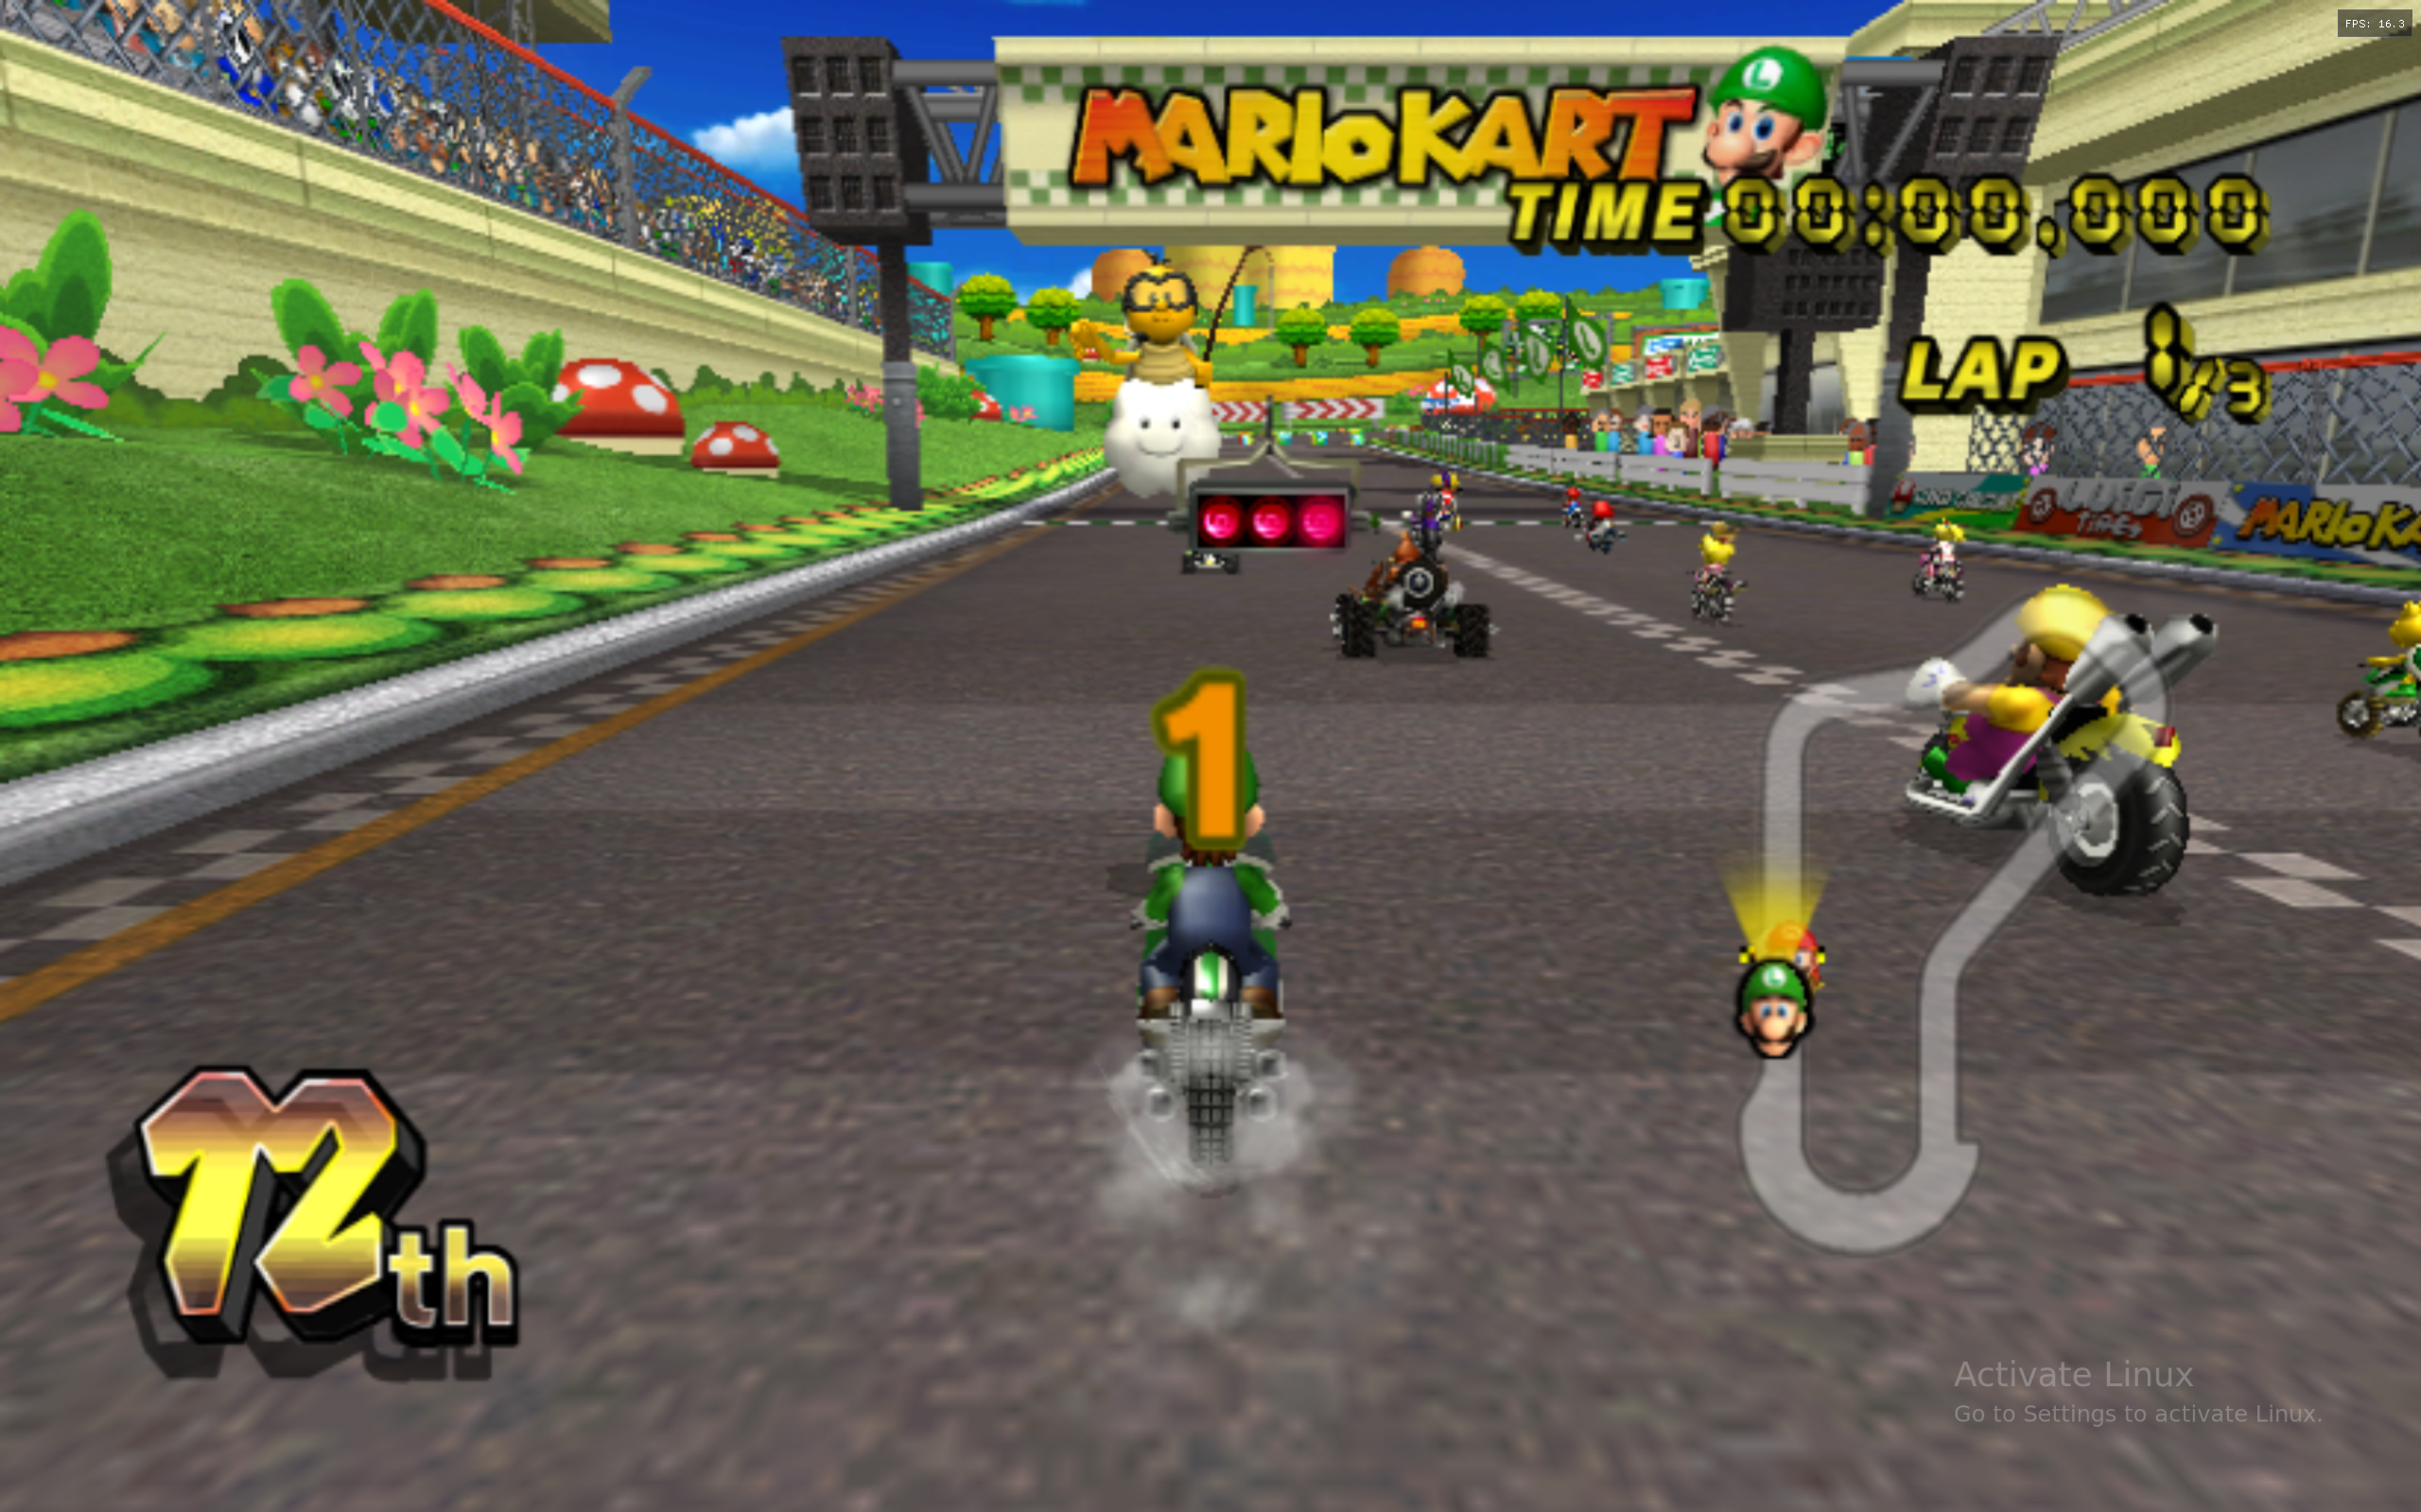
Let’s take a look at the reported screenshots in the issue. The first image is the misrender using the real Asahi AGX Vulkan driver, and the second is the expected result using Lavapipe.
AGX is the name of the Apple Silicon GPU architecture. The Vulkan driver for AGX in Mesa is called Honeykrisp. Lavapipe is a software implementation of Vulkan in Mesa
…
As you can see, there’s quite a bit wrong (poor Luigi!). Notable problems are: Vertices are being blown out (Luigi and Lakitu), some texture sampling issue (the Mario Kart banner, and maybe the flowers on the left), there’s some issue with color grading (everything seems yellow), the crowds are missing (???), the sky is messed up, some random black triangle in the bottom right (I also just noticed the “Activate Linux” logo LOL).
These seem to be both vertex and fragment issues, which is quite interesting. Does that mean there’re multiple issues in this misrender, or maybe the same issue affecting both stages?
Zelda
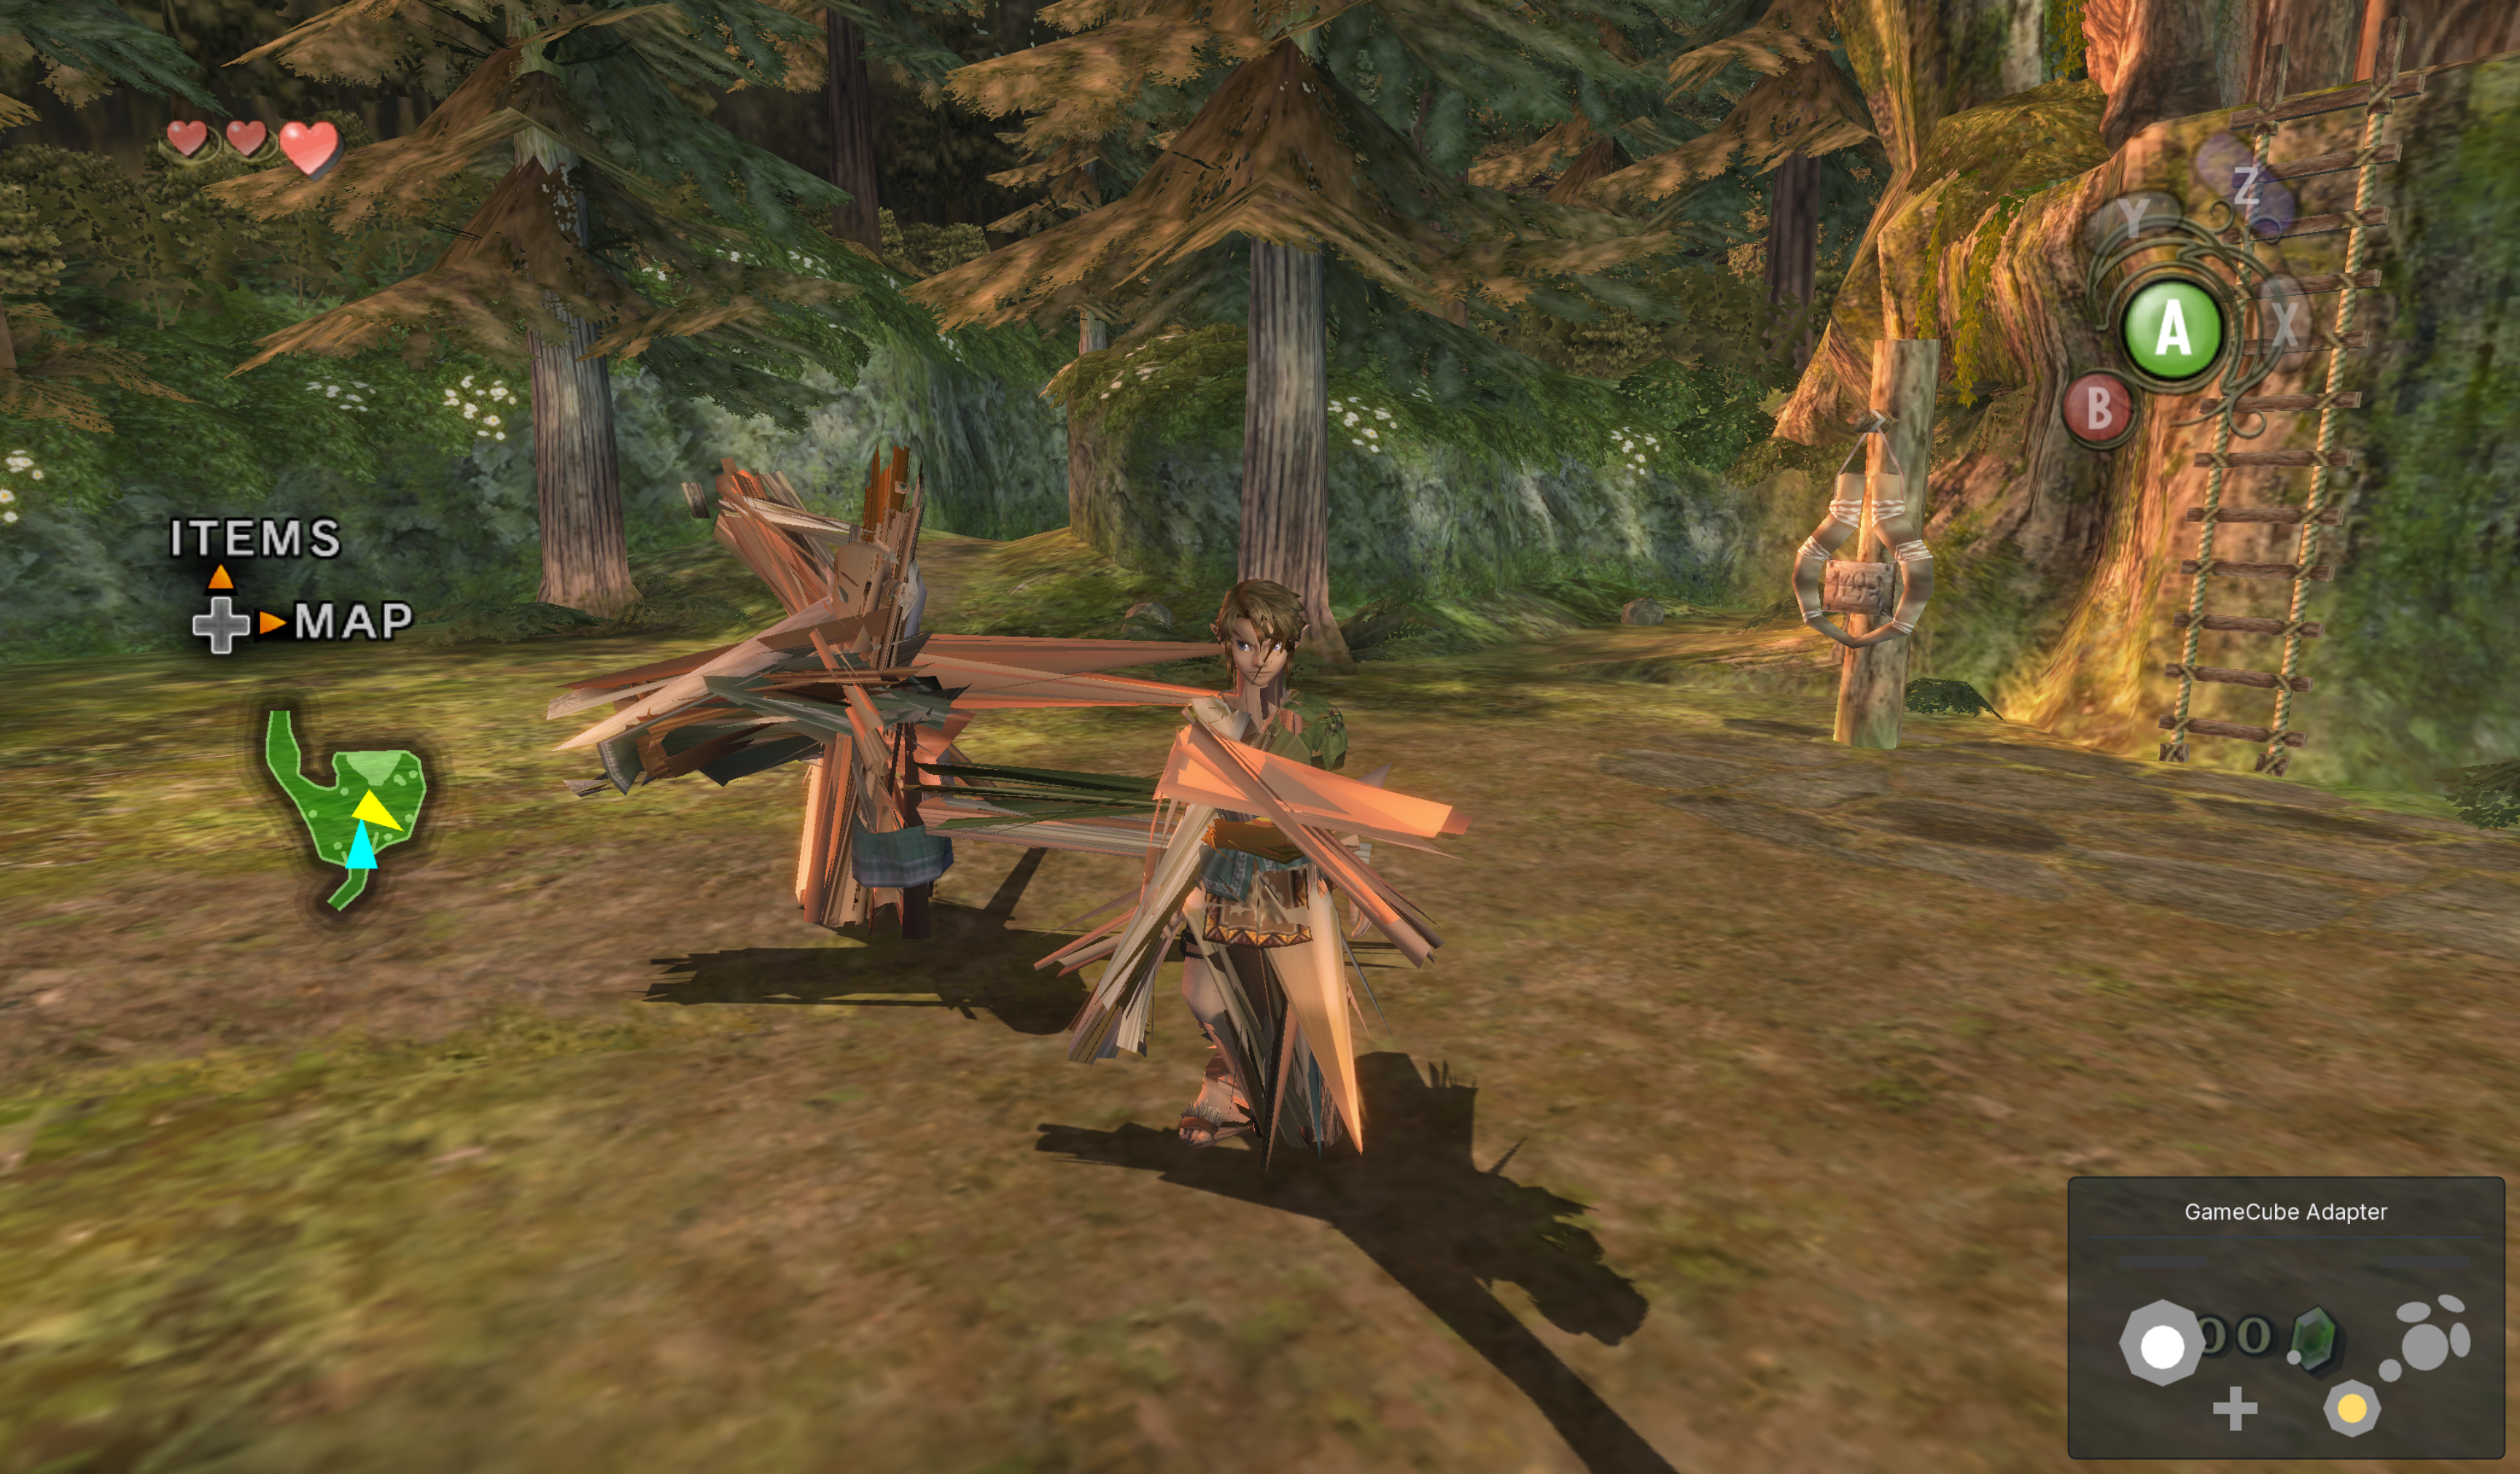
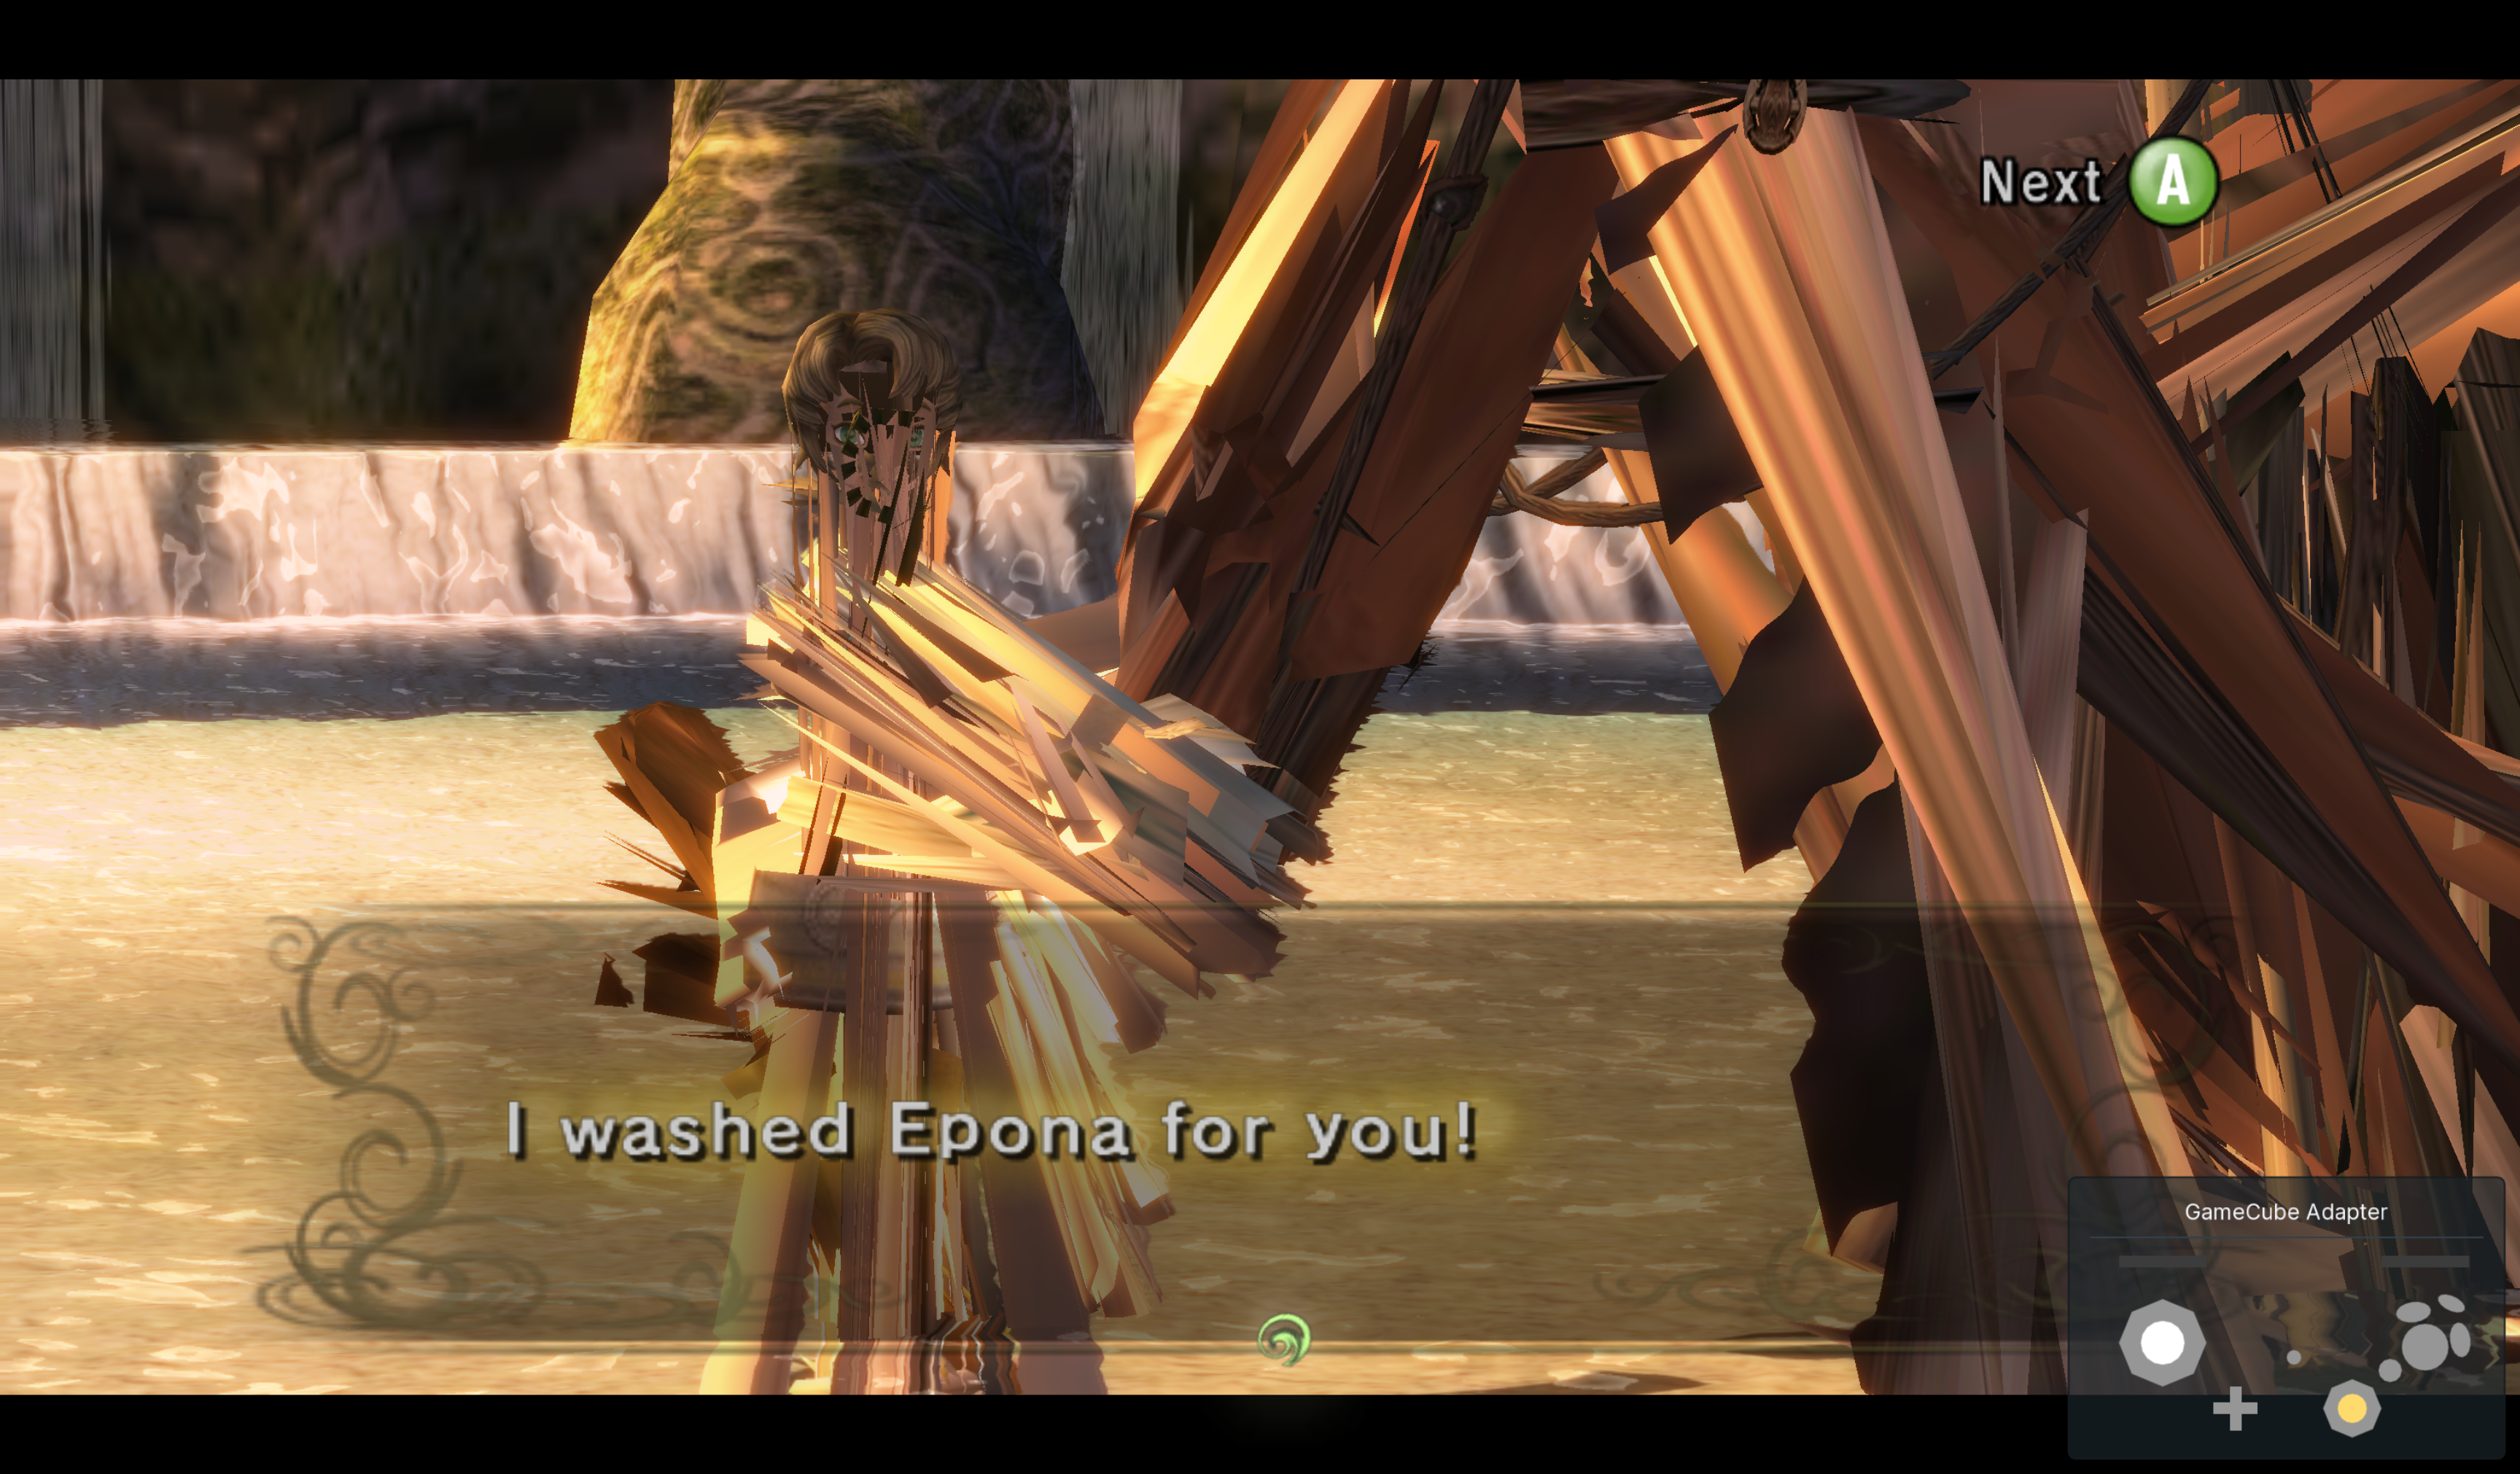
A rendering bug for a Zelda Twilight Princess emulator was reported later, and it turned out to be the same root issue:
Debugging
The first thing I tried was to insert the equivalent of a vkDeviceWaitIdle after each submission in the Honeykrisp driver, as well as inserting barriers before each draw call. This would indicate if it were some sort of synchronization issue. No luck. Nothing changed.
With that out of the way, I then wanted to open the game in RenderDoc and capture some frames. I had two instances of RenderDoc open, one running through Honeykrisp and the other running through Lavapipe. This let me quickly compare draw calls between the two.
The Sky
The first draw call I looked at was the broken sky. I suspected it was a vertex issue, and I thought it would be a simple skybox cube. It was not. RenderDoc can display the vertices produced by the vertex stage, and render the resulting mesh.
Let’s compare the skybox meshes produced by each drivers:
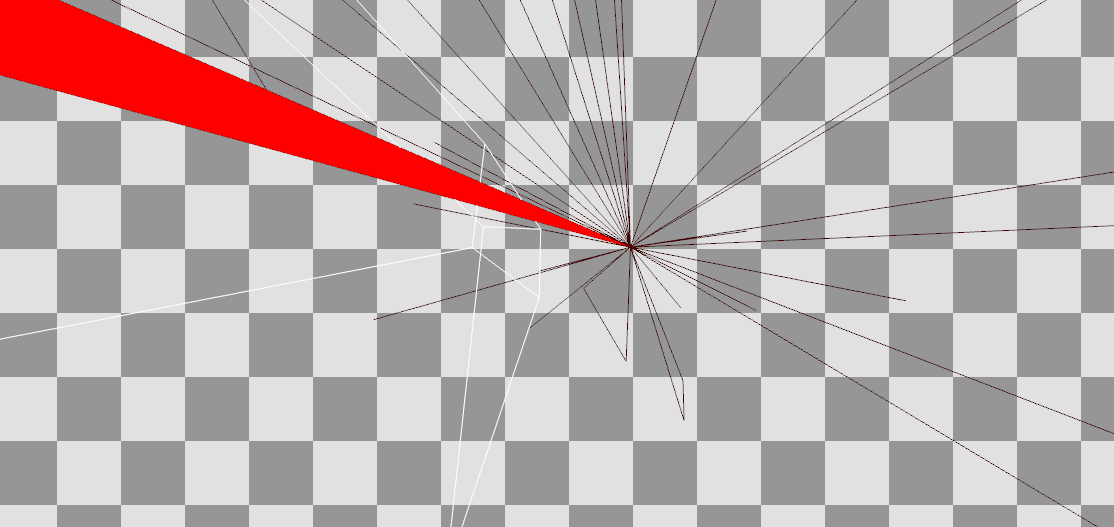
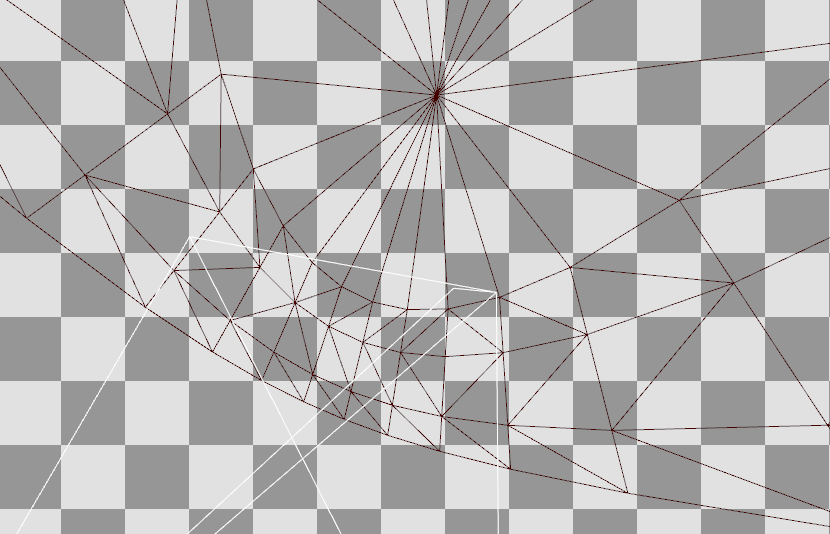
Clearly the Lavapipe result looks correct. It appears to be a structured shape, as opposed to the jumble of vertices that Honeykrisp produced. Definitely a vertex shader issue.
This was a good direction, but I felt it would be too unwieldy to continue with the sky draw call. It had 420 vertices, which is way too much information to digest. Let’s find a simpler draw call.
Post Processing Pass
I noticed a yellow triangle would sometimes flicker across the screen. Take a look:
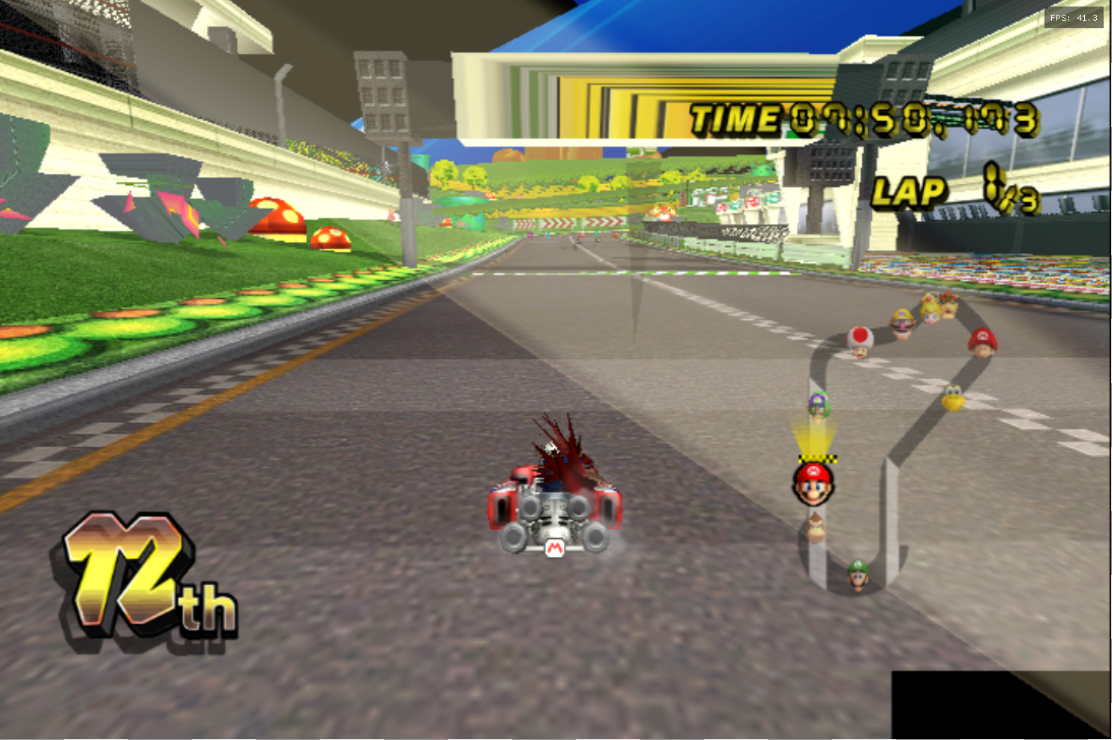
It would also flicker onto the other half of the screen. Clearly it was supposed to be a fullscreen quad, possibly acting as a post processing pass. This would be perfect for debugging! First, it let’s me easily find the draw call in RenderDoc, but more importantly, it should have well known and fixed vertices. I.e. the vertices should range from -1 to 1 (normalized device coordinates that Vulkan expects), with UVs from 0 to 1.
Let’s take a look at the draw call: 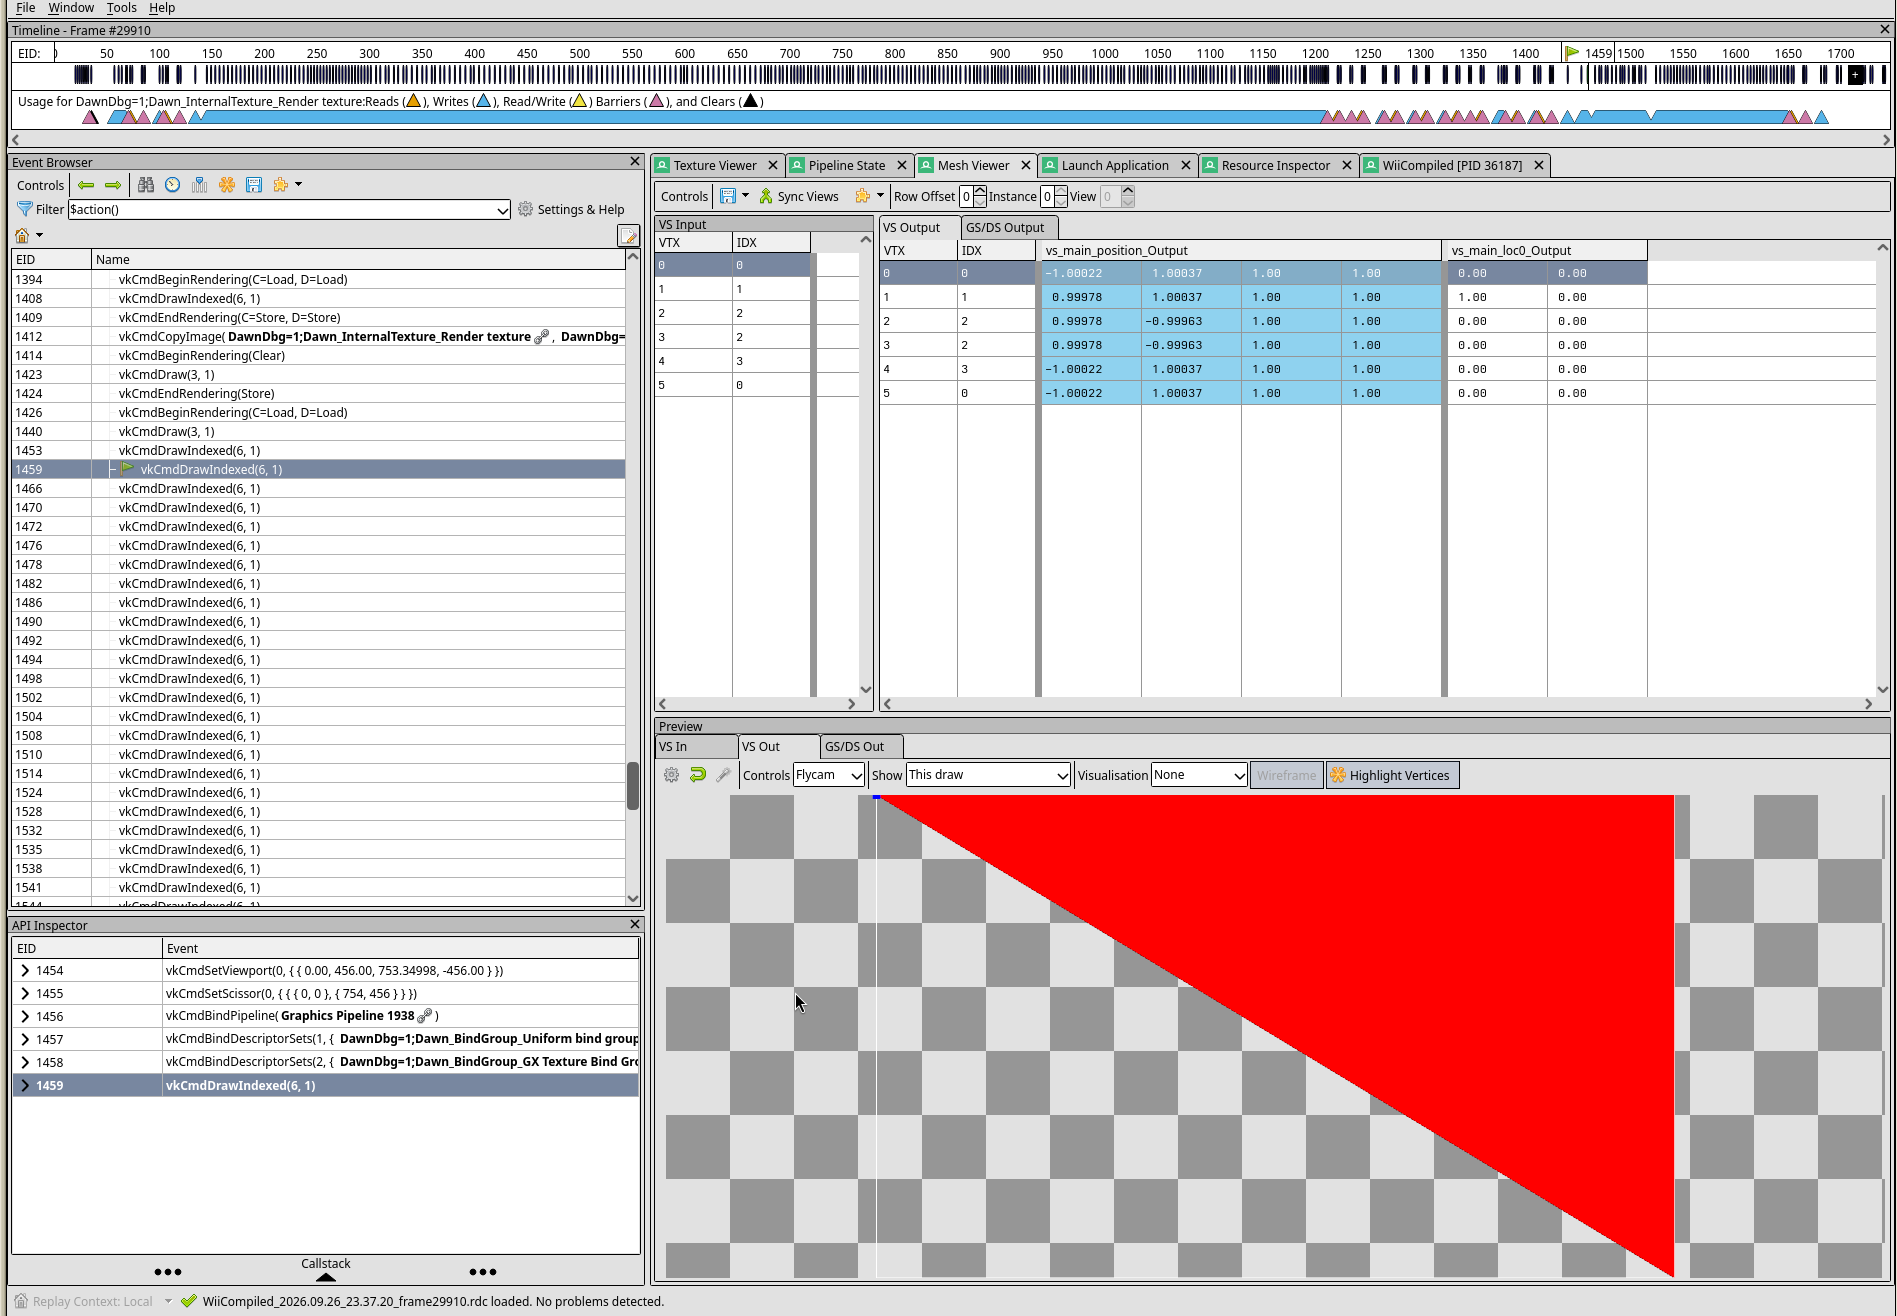
Yup, we can see the six vertices indicating that this is supposed to be a quad composed of two triangles. The vertices seem to range from… -1.00022 to 0.99978? That’s weird. But eh, close enough to -1 to 1.
The astute graphics programmer may look at this vertex output and notice something off. Vertex 0, 4, and 5 all have the same position. That’s not correct. We might expect a quad to have at most two duplicated vertices (i.e. the overlapping vertices at the top left and bottom right). But three of the same vertex position doesn’t make sense. We can also see this by selecting vertex 3:
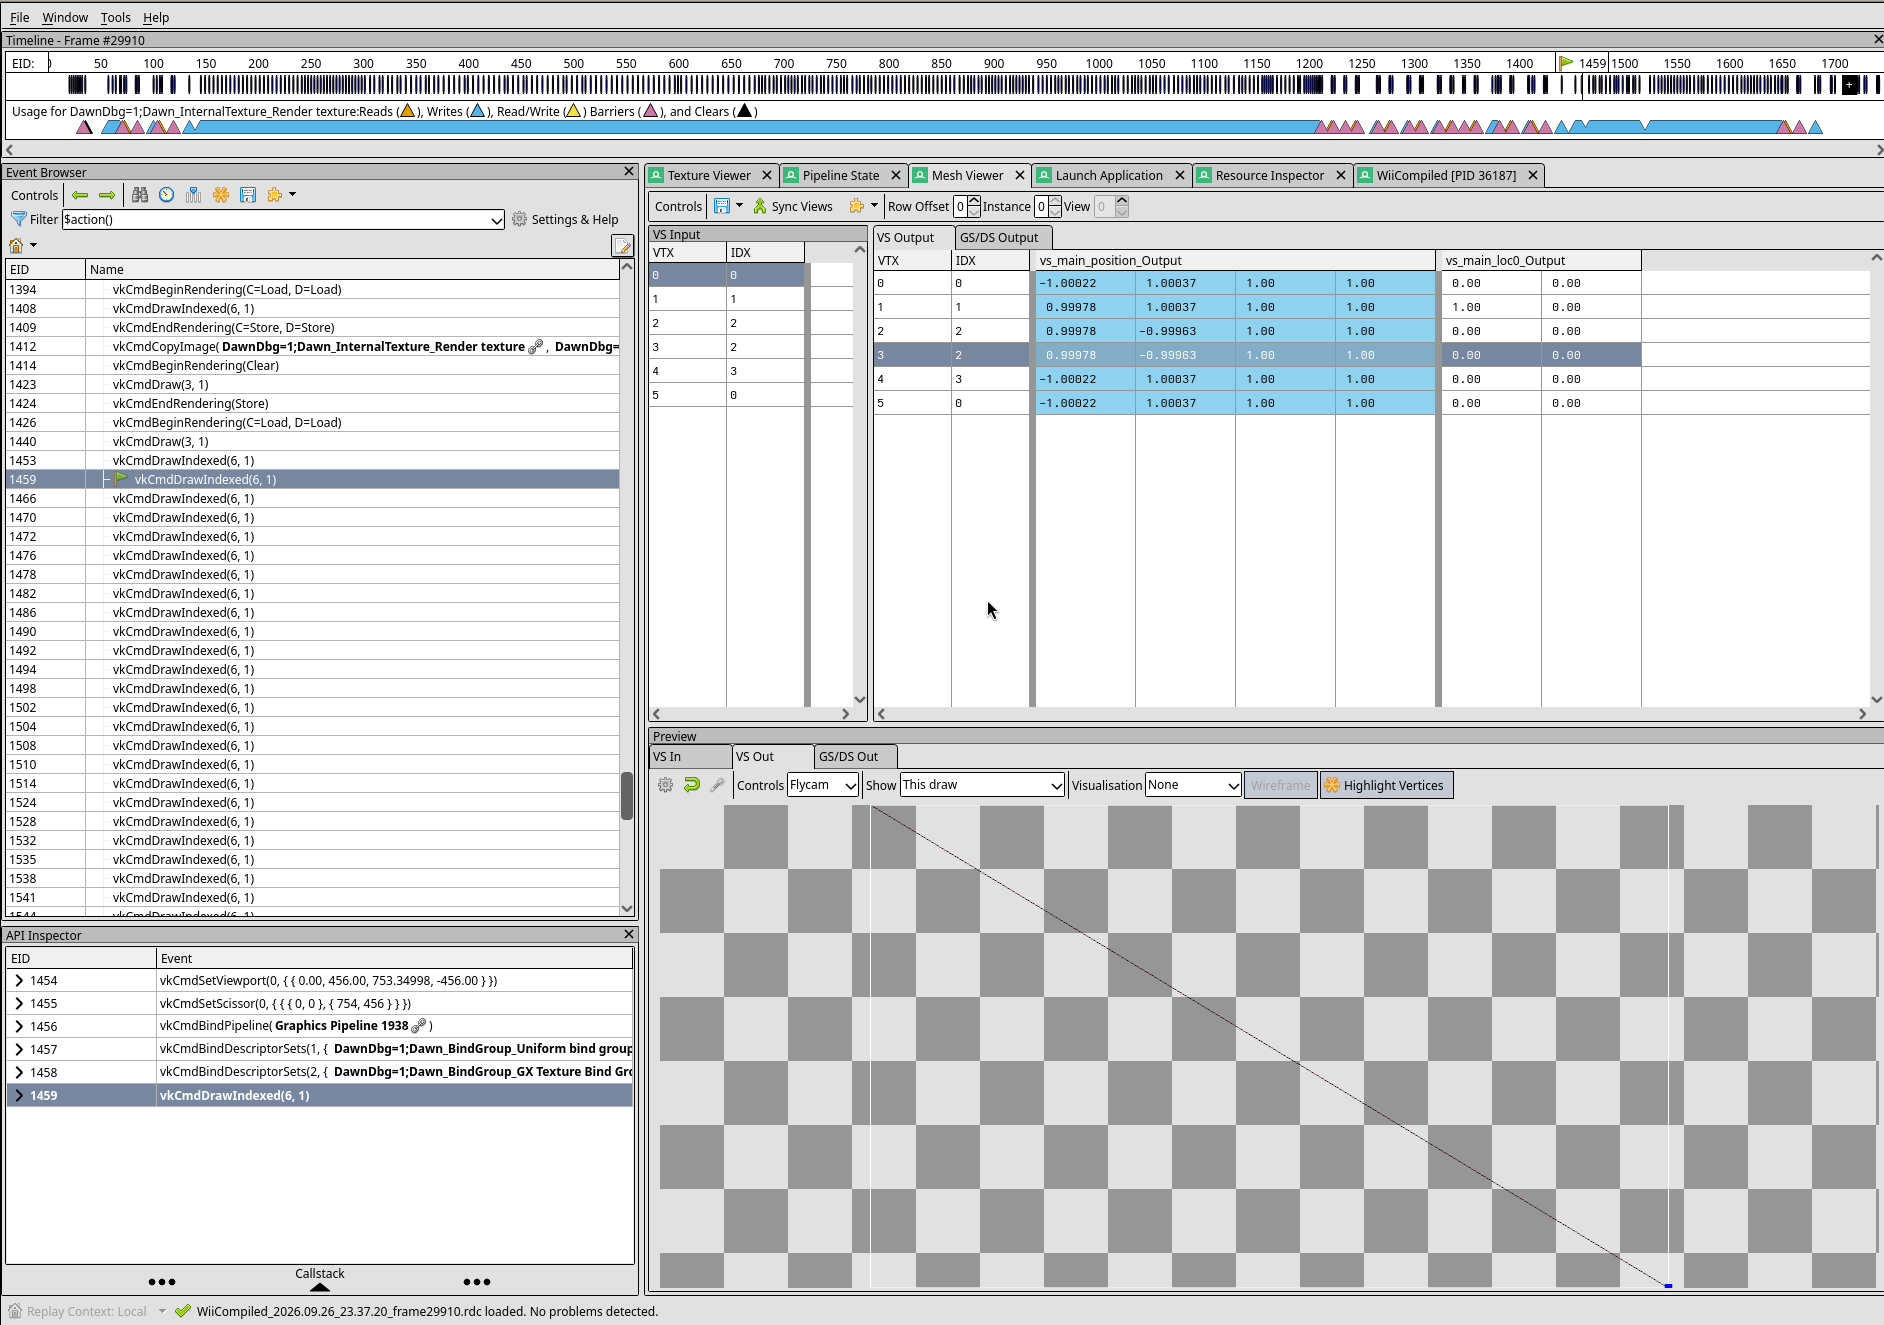
You’ll also notice the UV’s are messed up. There are way too many (0, 0) coordinates. You’d typically see coordinates like (0, 0), (1, 0), (0, 1), and (1, 1), but that doesn’t happen here.
Debugging the Vertex Shader
The obvious next step was to debug the vertex shader. RenderDoc has a step debugger for shaders which is sweeet. I spent some time stepping through these six different vertex invocations. Take a look at this, I’m debugging vertex 3 here:
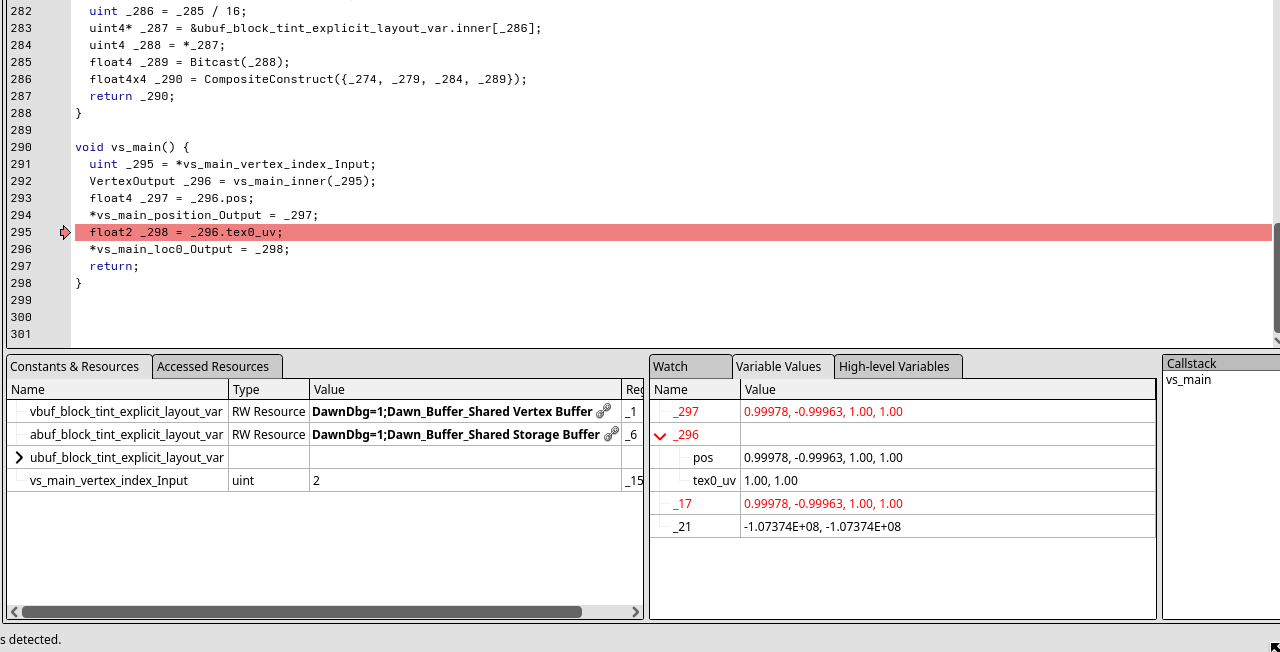
Here, vs_main is the shader entry point and vs_main_inner is the actual vertex shader. vs_main simply calls vs_main_inner, then assigns the resulting position and UV to the shader output variables (vs_main_position_Output, vs_main_loc0_Output).
Look closely above at the temporary variable _296 in the variables pane. This is the value directly emitted from the shader.
But wait… Let’s take a look back at the vertices from before:

The UV that the shader emitted for vertex 3, and the UV the debugger says it’s emitting do not match. This is quite illuminating.
It’s important to note that RenderDoc’s shader debugger doesn’t work like a CPU debugger. It’s not actually running the code on the GPU at the moment of stepping, nor are the displayed register values coming from the GPU. Instead, it interprets the shader IR completely on the CPU using the selected invocation’s input data.
At least that’s what I deduced from what’s happening. I did not look into how it works, but I’m 95% certain GPUs don’t support this kind of step debugging from the CPU side. It also seems pretty reasonable given this situation.
This seemed to narrow the issue down to one of two possibilities: either it’s a shader compilation issue (the actual shader machine code running on the GPU is logically different from the provided SPIR-V shader), or the shader is correct, but the varying data is being mangled somehow after it’s emitted from the vertex stage. I wasn’t even sure if the latter was possible, but it was something I considered anyways.
debugPrintfEXT
In order to narrow down the issue, I needed to somehow see what the shader was actually emitting. Let me introduce you to this real nifty GLSL/Vulkan extension provided function debugPrintfEXT. It’s a way to print debug messages from within the shader! You invoke the function exactly like printf in C, but it also has some added format specifiers for printing vectors. Additionally, RenderDoc will capture the debug messages and associate them with the exact invocation they came from (in our case the vertex invocation)! Very nice.
I wanted to do something like this:
void main() {
    vec4 position = main_inner();
    debugPrintfEXT("position is %v4f\n", position);
    gl_Position = position;
}
Minimal Reproducible Sample
I wanted to create a minimal reproducible sample to more easily debug the shader. This will come in handy later when dumping shaders. I’ll reproduce the draw call we’ve been looking at, the postprocessing pass. To do this, I’ll need to extract the shaders along with the buffers used by the shaders.
WiiCompiled sets up two massive readonly storage buffers, and binds them in pretty much every render pass. I don’t know what exactly these buffers contain, and it’s not important (I did note that the shader uses one of them to grab its vertex positions from). Regardless, the simplest thing to do was extract the entire buffer and save it to disk so it could be used by the reproduction later. Thankfully, RenderDoc is able to export the buffers and save them to a binary file. I extracted the buffers, along with the small uniform buffer passed to the postprocessing pipeline.
Dead End
WiiCompiled uses Dawn for rendering (a native WebGPU implementation made by Google) rather than making Vulkan calls directly. For some reason, I thought it would be a good idea to use Dawn for the reproducible sample. This turned out to be a huge pain. First, as with every Google project, it was a headache trying to build Dawn from source, so much so that I gave up. Instead, I found that WiiCompiled included Dawn as a static library (WiiCompiled compiles the game locally directly from the original game files), and that worked fine.
I also needed the WGSL shaders. WiiCompiled constructs the WGSL shaders on the fly with string templating, so there’s no static asset directory I can just grab the shaders from.
My solution was to create a wrapper for Dawn function wgpuDeviceCreateShaderModule, which is where the WGSL shaders are passed into. This is not too difficult to do if the function exists in a shared object, but as you’ll remember, Dawn is statically linked into the WiiCompiled game executable. I hacked around this by compiling the static library (the .a file) into a shared object (.so) using GCC. Remember, .a files are essentially just relocatable object files like standard .o files. So if we pass just this file into GCC, and use the -shared flag to link a shared object, we’ve effectively converted our static library into a shared library. Neat.
Once I had the shared library, I needed WiiCompiled to use it somehow. WiiCompiled expects the Dawn library to be a static .a file, so how do I give it the .so file? Simple, rename the .so to .a and replace the static library with that. And… that worked? Cool I guess. I verified that WiiCompiled could still build and run the emulated game, and it did.
Then, I created my own shared object containing a wgpuDeviceCreateShaderModule function. This function takes the given WGSL source code, then writes it to a file. Thankfully, WiiCompiled passes a shader label, so I used that as the output filename. Finally, we call into the original wgpuDeviceCreateShaderModule function residing in the Dawn module so that the emulator can continue on without error. I was then able to load my shared object with LD_PRELOAD which gives priority to my wgpuDeviceCreateShaderModule wrapper function when WiiCompiled tries to dynamically link it. Noice.
This worked and around 1200 WGSL shaders were dumped onto disk. How do we find the correct one for the postprocessing pass? Well thankfully the shader label I mentioned also appears in RenderDoc:

Looking at the WGSL dump, a file named “GX Shader fde6180885…” exists! So this is the shader code for our postprocessing pass!
It was at this point that I realized WGSL does not support debugPrintfEXT… So this won’t work. I’m at a dead end 💀💀💀
I probably could’ve continued down this route by instead binding an output buffer for and writing the vertex data to that, but I guess I didn’t think of that
At least it was a little helpful to read the original WGSL source to more easily see what was going on.
The Non Dead End
At this point I decided to create the minimal reproduction in Vulkan. I used the MESA_SPIRV_DUMP_PATH environment variable to dump all SPIR-V used in the program. I then found the specific postprocessing shader file by matching the BLAKE3 hash from the shader pipeline to the filename (I implemented better support for KHR_pipeline_executable_properties, which gave me this information). Then, once I had the postprocessing shader, I decompiled it to GLSL using spirv-crosss.
I setup a tiny Vulkan program with a simple graphics pipeline using the vertex shader I extracted, and I replaced the fragment shader with a simple one that emits the UV as the final color. I created and bound the storage buffers I mentioned earlier. The storage buffer data was loaded into static C arrays using the new #embed feature in C/C++. It then made a single draw call in a render loop with the pipeline.
With this, we get our single triangle: 
Sweet! This also reinforces that the issue is not related to synchronization, since we only have a single render pass with a single draw call.
I then inserted the printf call into the vertex shader like this:
void main() {
    _116 _298 = _115(uint(gl_VertexIndex));
    debugPrintfEXT("Position = %v4f, UV = %v2f\n", _298._m0, _298._m1);
    gl_Position = _298._m0;
    _21 = _298._m1;
}
I ran the program through RenderDoc, and our debug messages appeared! What’s more, they matched the shader output values (rather than what the debugger said)! (I wanted to upload a screenshot of the debug messages, but for some reason I can’t seem get debugPrintfEXT working again :( I don’t remember it being difficult to setup, but for some reason nothing I try yields those messages in RenderDoc. Also, the validation layers are saying its not supported. Not sure what’s going on, but trust me, I had this working before).
This confirmed that the issue was related to shader compilation: the vertex output differing from the debugger indicates that something is broken during SPIR-V to AGX compilation.
Bisecting the Shader
Before debugging shader compilation, I wanted to bisect the shader to find the exact point at which the broken shader diverges from the expected shader. I did this by inserting debugPrintfs throughout the shader, then stepping through the expected shader in RenderDoc and comparing the registers/variables to the debug message output. For example:
_116 vs_main_inner(uint _117) {
    debugPrintfEXT("_117 = %u", _117);

    _116 _120 = _116(vec4(0.0), vec2(0.0));
    debugPrintfEXT("_120._m0 = %v4f\n", _120._m0);
    debugPrintfEXT("_120._m1 = %v4f\n", _120._m1);
    ...
    return _120;
}
The _120 variable is the return value of vs_main_inner. As we saw above, this contains the position and uv, so this is the value I’ll want to be tracing. I stepped over the line initializing _120 in RenderDoc so I could see its value, then confirmed that it matched the value logged by the corresponding debugPrintfs. Since this is a simple struct constructor, I wasn’t surprised that it matched. I then repeated this process until I found the expression that diverged. Look at this big expression:
_120._m0 = vec4(
    vec4(
        vec3(
            _102(
                _9._m0[2u].x + (
                    _44(
                        (
                            _9._m0[0u].x + (_117 * 2u)
                        ) + 0u
                    ) * 2u
                ),
                0u,
                false
            ),
            0.0
        ),
        1.0
    ) * _165(
        144u + (min(_9._m0[0u].y, 0u) * 48u)
    )
) * _172(80u);
It doesn’t really matter what this is doing. I traced this by logging every important subexpression from inside out:
debugPrintfEXT("a = %u\n", _9._m0[0u].x + (_117 * 2u));
debugPrintfEXT("b = %u\n",
    _44(
        (
            _9._m0[0u].x + (_117 * 2u)
        ) + 0u
    )
);
debugPrintfEXT("c = %u\n",
    _9._m0[2u].x + (
        _44(
            (
                _9._m0[0u].x + (_117 * 2u)
            ) + 0u
        ) * 2u
    )
)
// and so on
The divergence seemed to be coming from that _44 function. _44 is a direct wrapper around function _24. Let’s look at _24:
uint _24(uint _25) {
    return (_1._m0[_29(_25, 4u)] >> (((_25 & 3u) * 8u) & 31u)) & 255u;
}
I repeated the bisection process for each of these subexpressions. I discovered that the right hand side of that bitshift was waaay bigger than RenderDoc said it should be, so the shift was resulting in 0 instead of the expected value 3. Very interesting. Another peculiar thing happened. When logging the subexpressions, the divergence went away if I ordered the printfs just right. Hmm… this led me to believe the issue was related to an optimization. At this point I figured this expression would be easy and distinct enough to find in the AGX assembly dump and/or the NIR dump. Let’s move on to compilation debugging.
Debugging the Shader Compiler
In Mesa, SPIR-V isn’t translated directly to the machine code of the GPU. Instead, it’s first compiled into an intermediate representation called NIR, and the drivers are responsible for translating NIR into their respective GPU’s shader code. This allows a bunch of work and optimizations to be reused.
Debugging AGX disassembly
I can dump the NIR and AGX disassembly by setting the environment variable AGX_MESA_DEBUG=shaders. This is a snippet of the corresponding AGX disassembly for the _24 function we were looking at:
iadd $r1, u12.sx, ^r5.sx, lsl 1
shr  r2, $r1, 2
load r2, du14, r2, i32, x, a
iadd $r3, 0, r1.sx, lsl 3
wait a
bfeil $r2, 0, $r2, r3, 8
...
Don’t worry about understanding the details.
Let’s break it down:
iadd $r1, u12.sx, ^r5.sx, lsl 1
Corresponds to the parameter passed to _24:
_9._m0[0u].x + (_117 * 2u)
_117 is the gl_VertexIndex, and ^r5 is the AGX register that is preloaded with the vertex index before the shader runs. u12 is the uniform register for _9. The lsl 1 shifts the ^_r5.sx by 1, a.k.a. multiplies by 2.
shr r2, $r1, 2
Corresponds to:
_29(_25, 4u)
We haven’t looked at _29, but it essentially multiplies the previous result by 4, exactly what the shr instruction does.
load r2, du14, r2, i32, x, a
Corresponds to:
_1._m0[_29(_25, 4u)]
The du14 register corresponds to the _1 uniform variable. The load instruction indexes into the uniform using the previous result (in _r2).
bfeil $r2, 0, $r2, r3, 8
This is a “bit field extract”, it essentially takes $r2, shifts it by r3, then takes the 8 bottom bits, or ANDs by 255. So this corresponds to the bitshift and the & 255u above.
But wait I skipped one:
iadd $r3, 0, r1.sx, lsl 3
Corresponds to
((_25 & 3u) * 8u) & 31u
But does it? The lsl 3 corresponds to the * 8, which is correct, but then we’re just adding that result to 0 and storing in r3. Where did the & 3u and & 31u go? It seems like this is just computing _25 * 8u. And there are no more instructions that do any sort of bitmasking before this value is used in the bfeil.
These seem like very important operations that are being left out. Earlier I said that the debugPrintf output showed the shift amounts begin too large resulting in the shift yielding 0. If you think about it, leaving out these bitmasks would make the shift amount much larger than expected. For example, say _25 contains the value 0x156. The result of ((_25 & 3u) * 8u) & 31u will be 0x10. But _25 * 8u, will result in 0xab0!!
Shifting by 0x10 wont necessarily make the shift result 0, but 0xab0 definitely will.
This has got to be the issue!
Debugging NIR optimizations
It seems that the missing masks were being optimized out somewhere in the NIR optimization passes. I confirmed this by dumping the NIR both immediately after it was generated from the SPIR-V and immediately before it was translated into AGX machine code. The former did in fact have the masks while the latter didn’t.
Here’s the unoptimized NIR:
...
%66 = @load_deref (%65)
%67 = @load_deref (%43)
%68 = load_const (0x000003)
%69 = iand %67, %68 (0x000003)     -> & 3
%70 = load_const (0x000008)
%71 = imul %69, %70 (0x8)          -> & 8
%72 = load_const (0x00001f = 31)
%73 = iand %71, %72 (0x1f)         -> & 31
%74 = ushr %66, %73
%75 = load_const (0x00000ff = 255)
%75 = iand %74, %75 (0xff)         -> & 255
...
Register names like %72 (0x1f) mean %72 has the constant value 0x1f
After optimization, this becomes:
%4  = /* input parameter */
...
%12 = imadshl_agx %10 (0x0), %3 (0x1), %4, %11 (0x3)
%13 = ubitfield_extract %7, %12, %9 (0x8)
...
imadshl_agx is a fused instruction that computes (%10 * %3) + (%4 << %11) or (0 * 1) + (%4 << 3) or %4 * 8 ubitfield_extract is our bitfield extract from before, extracting the bottom 8 bits, or masking by 255.
Notice that & 3 and & 31 are missing now.
I wanted to bisect the NIR passes to determine when this was being optimized away. I didn’t know at the time, but Mesa has a script for doing this called nir_shader_bisect.py which may have been useful here. Instead, I manually went through inserting NIR shader dumps after certain passes, effectively doing a binary search until I found the point at which missing masks went missing.
Algebraic Optimizations
This led me to an optimization pass called nir_opt_algebraic. This pass optimizes algebraic, or ALU instructions. For example, a * 1 can be optimized into a (no multiply). There are thousands of these peephole optimizations defined in a python file nir_opt_algebraic.py which generates C code. This allows these optimizations to be defined easily. The multiplication example is defined as follows:
# Written in the form (<search>, <replace>) where <search> is an expression
...py
            (('imul', a, 0), 0),
            (('umul_unorm_4x8_vc4', a, 0), 0),
            (('umul_unorm_4x8_vc4', a, ~0), a),
            (('fmul', a, 1.0), ('fcanonicalize', a)),
    ----->  (('imul', a, 1), a),
            (('fmul', a, -1.0), ('fneg', a)),
            (('imul', a, -1), ('ineg', a)),
...
Each of these defines a separate peephole optimization. As the comment says, the outer tuple has a “search” expression, and a “replace” expression. The “search” tuple, in this case ('imul', a, 1), states if an imul instruction is encountered, and it has an operand a (any value, a register, a constant, whatever. a defines a name that can be used later), then this optimization matches, and we replace that instruction with the “replace” expression.
So in this case, if ('imul', a, 1) matches, it is replaced with just a, where a is the name we gave to the first operand in the “search” expression.
The cool thing is operands can be nested expressions. For example:
...
   (('ineg', ('ineg', a)), a),
...
This says if we have a double negation, just replace it with the original value.
So something like this would be optimized out:
%1 = ineg %0
%2 = ineg %1
I found a disabled code block in some of the algebraic optimization logic that logs every peephole optimization that’s applied. This is perfect as it allowed me to pinpoint exactly where the missing masks were being optimized out. I enabled the block, and bingo! I found this optimization being applied:
for s in [8, 16, 32, 64]:
    amount_bits = int(math.log2(s))
...
    (('ushr', 'a@{}'.format(s), ('ishl(is_used_once)', ('iand', b, 3), amount_bits - 2)), ('ushr', a, ('ishl', b, amount_bits - 2))),
...
This matches NIR such as:
%1 = iand b, 3
%2 = ishl %1, 3
%3 = ushr a, %2
And replaces it with:
%2 = ishl b, 3
%3 = ushr a, %1
This is exactly what we’re seeing! The ishl %1, 3 is our multiplication by 8, the ushr is our right shift, and iand b, 3 is our missing mask! This optimization removes the iand b, 3… But why?
SM5
I was confused by this optimization for a while. It seemed wrong, there’s no world in which these two sequences of instructions are equivalent, if b here is large, then the shift amount will be large if it’s not masked, resulting in the right shift of 0.
Then, after git blaming, and reading through the merge request in which this was added, I realized NIR semantics assume the hardware’s shift instructions will mask the shift amount to use only the relevant least significant bits. I.e. when shifting a 32 bit integer, only the 5 least significant bits in the shift amount do anything. If any other bits are set, the result will be 0 (2^5 == 32). So NIR assumes 32 bit shift instructions mask the shift amount by 0x1f. This is defined by shader model 5 (SM5). As it turns out, the AGX shift instructions do not do this, they use the full shift amount directly without masking.
With that in mind, this optimization does make sense, I’ll leave it as an exercise to the reader to see how it works. It does not make sense however if the hardware doesn’t mask the shift amount.
The issue is already solved?
When I discovered the SM5 assumption, my idea was to add an algebraic optimization specific to AGX that inserts a mask on the shift amount any time it encounters a shift operation. So something like this:
(("ushr", 'a@32', b), ("ushr", a, ('iand', b, 0x1f)))
I found a file agx_nir_algebraic.py which defines algebraic optimizations specific to AGX.
Hold up… the above optimization is already defined in this file:
# Our shifts differ from SM5 for the upper bits. Mask to match the NIR
# behaviour. Because this happens as a late lowering, NIR won't optimize the
# masking back out (that happens in the main nir_opt_algebraic).
for s in [8, 16, 32, 64]:
for shift in ["ishl", "ishr", "ushr"]:
lower_sm5_shift += [((shift, f'a@', b),
(shift, a, ('iand', b, s - 1)))]
What gives?
Fused Optimizations
Remember when I showed this optimized NIR earlier?
...
%12 = imadshl_agx %10 (0x0), %3 (0x1), %4, %11 (0x3)
%13 = ubitfield_extract %7, %12, %9 (0x8)
...
Well this doesn’t use the simple shift instructions ["ishl", "ishr", "ushr"] used in the lower_sm5_shift expressions. We did have simple shift instructions in the unoptimized NIR, but these are lowered into fused instructions, since presumably the fused instructions are better in some way. In fact we can see one of those fused lowerings in this file:
...
    s = 3
...
    (('ishl', a, s), ('imadshl_agx', 0, 1, a, s)),
...
The problem is, this fused optimization is happening before we can do the SM5 mask fixup. The ishl is replaced with imadshl_agx, so it is not matched in the SM5 fixup pass. But imadshl_agx has the same non-masking property as the simple shift instructions! This is why it’s breaking! The same goes for ubitfield_extract, it also does an internal bit shift without masking the shift amount, so it also breaks. And we have two of these broken instructions back to back, no wonder things are messed up!
There are two possible solutions I could think of here. Either reorder some of the optimization passes, or add algebraic replacement expressions for imadshl_agx and ubitfield_extract (along with other similair variants) at the same time as the simple shift replacement expressions.
I decided to leave the optimization pass ordering alone, and add the replacement instructions instead. I thought this would be simpler, and I wasn’t super confident about the pass ordering semantics.
This is what I came up with:
# Our shifts differ from SM5 for the upper bits. Mask to match the NIR
# behaviour. Because this happens as a late lowering, NIR won't optimize the
# masking back out (that happens in the main nir_opt_algebraic).
for s in [8, 16, 32, 64]:
for shift in ["ishl", "ishr", "ushr"]:
lower_sm5_shift += [((shift, f'a@', b),
(shift, a, ('iand', b, s - 1)))]
for shift in ["imadshl_agx", "imsubshl_agx"]:
lower_sm5_shift += [((shift, f'a@', b, c, d),
(shift, a, b, c, ('iand', d, s - 1)))]
# bitfield_extracts do a shift internally, so we need to mask the offset parameter
lower_sm5_shift += [
# These are based on the lowerings from nir_opt_algebraic, but conditioned
# on the number of bits not being constant. If the bit count is constant
# (the happy path) we can use our native instruction instead.
(('ibitfield_extract', f'value@', 'offset', 'bits(is_not_const)'),
('bcsel', ('ieq', 0, 'bits'),
0,
('ishr',
('ishl', 'value', ('isub', ('isub', 32, 'bits'), ('iand', 'offset', s - 1))),
('isub', 32, 'bits')))),
(('ubitfield_extract', f'value@', 'offset', 'bits(is_not_const)'),
('iand',
('ushr', 'value', ('iand', 'offset', s - 1)),
('bcsel', ('ieq', 'bits', 32),
0xffffffff,
('isub', ('ishl', 1, 'bits'), 1)))),
# At this point, bitfield extracts are constant. We can only do constant
# unsigned bitfield extract, so lower signed to unsigned + sign extend.
(('ibitfield_extract', f'a@', b, '#bits'),
('ishr', ('ishl', ('ubitfield_extract', a, ('iand', b, s - 1), 'bits'), ('isub', 32, 'bits')),
('isub', 32, 'bits'))),
(("ibitfield_extract", f'a@', 'offset', '#bits'),
("ibitfield_extract", a, ('iand', 'offset', s - 1), 'bits')),
(("ubitfield_extract", f'value@', 'offset', '#bits'),
("ubitfield_extract", 'value', ('iand', 'offset', s - 1), 'bits'))
]
This handles all forms of shifting I could find.
Testing Out
With these changes I ran the simple reproduction, and…

Well it doesn’t look like a fullscreen quad… But maybe my assumption about this pass being a postprocessing pass was wrong?
When I was actually testing this out for the first time, I was using different storage buffer/uniform data, and it did produce a fullscreen quad
I decided to run the emulator with the new changes: 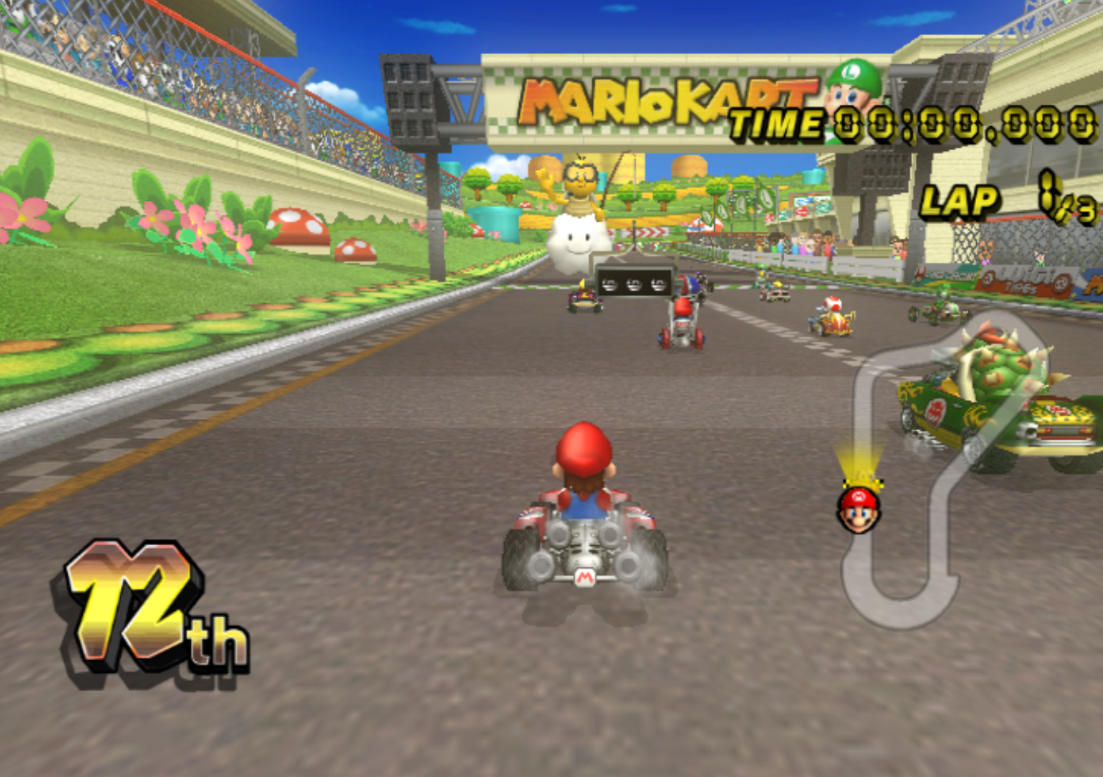
Everything is fixed? Ehh, I didn’t believe it at first. I thought I had accidentally run it with Lavapipe. But nope, apparently this issue was responsible for all the brokeness in the game: the blown out vertices, the broken texture samping, etc.
This fixed the blown out vertices in the Zelda emulator as well: 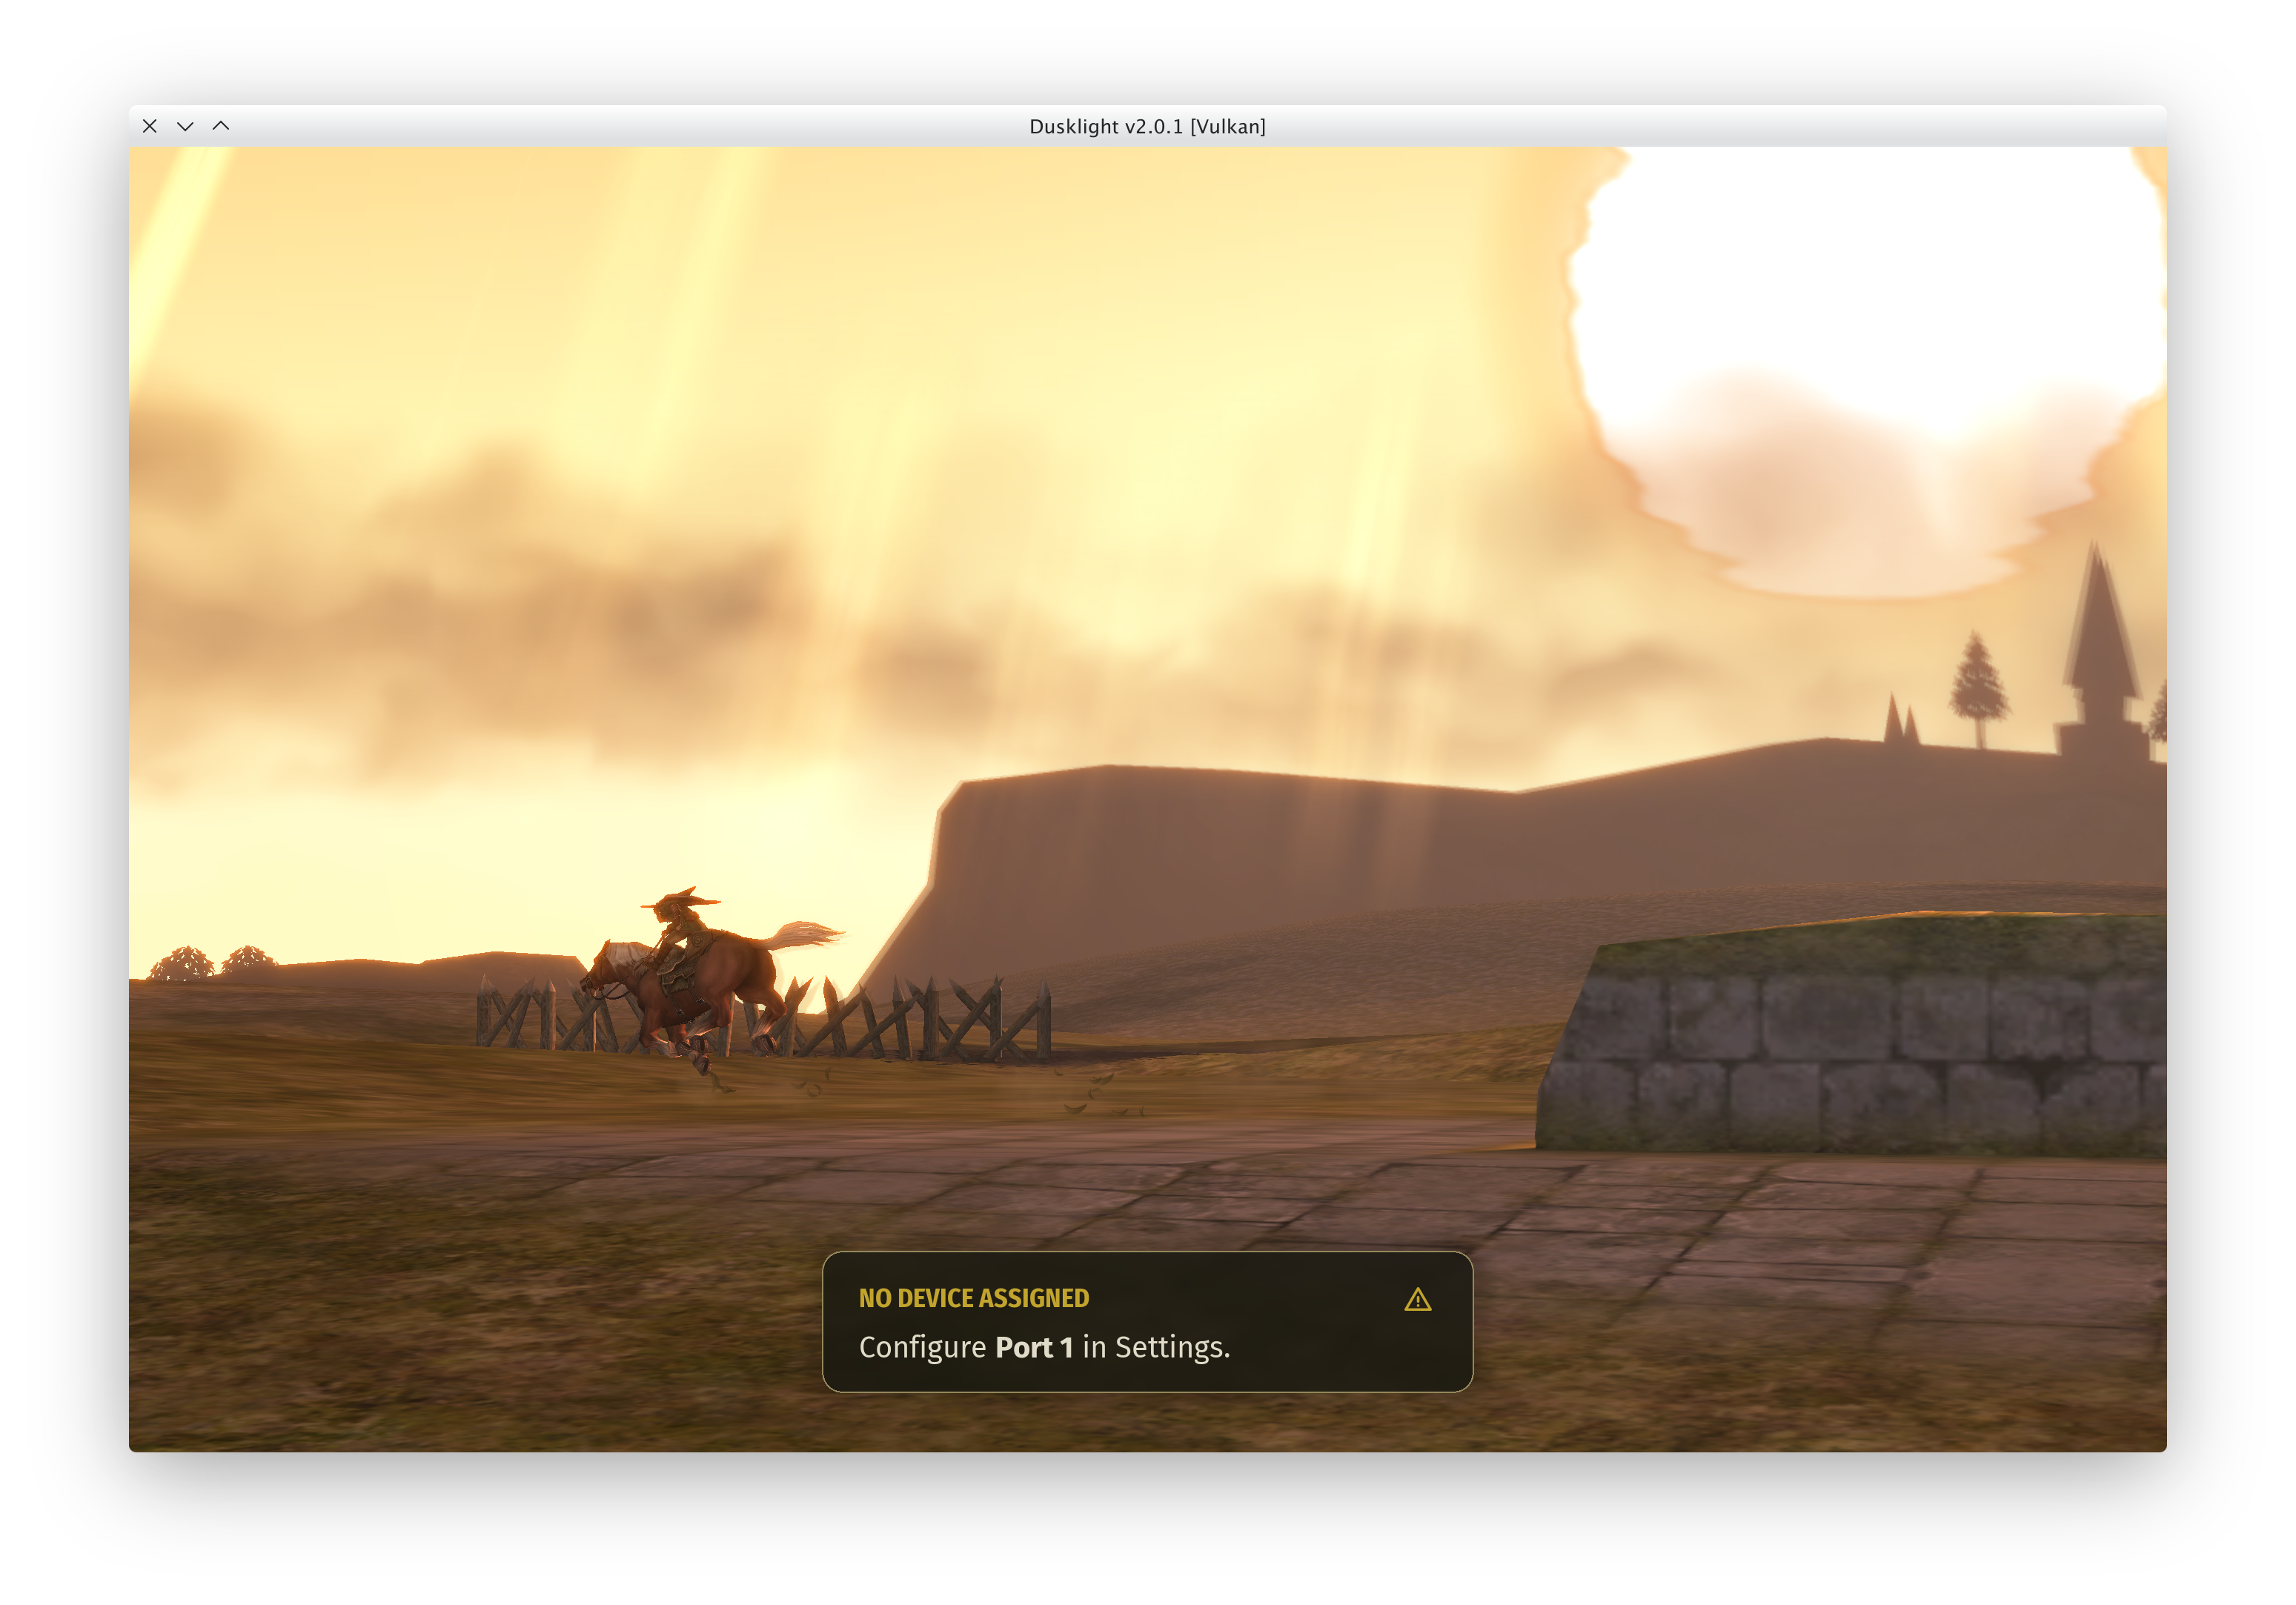
End
I submitted my first Mesa merge request, and it was merged!
It was a lot of work figuring this out, and I’m quite proud of it. I plan to continue contributing to Mesa in the future.